 Written by:
Genya Gorshtein, MSc
Published: January 6, 2023
Introduction
Kinetics of antibody-antigen interactions shape the immunological response, impacting antibody penetration, specificity, and efficacy. Antibody affinity and avidity are important characteristics of overall binding kinetics and efficacy of the immune response. While these characteristics have their similarities, they are often confused with one another. Affinity describes the strength of a single interaction whereas avidity measures the overall strength of a multivalent interaction (Figure 1).
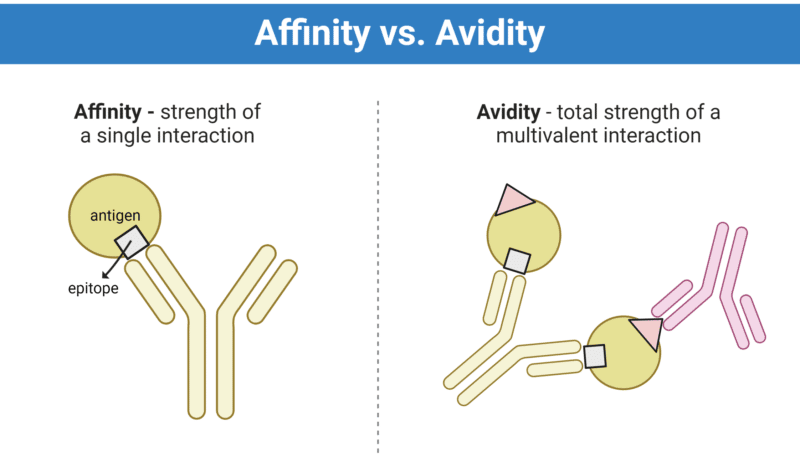
Figure 1. Antibody affinity versus avidity. Affinity describes the strength of a single interaction, whereas avidity describes the total strength of a multivalent interaction.
What is Affinity?
Affinity is the strength of a single interaction, such as the interaction between an epitope on an antigen and the antibody at a single binding site (Figure 1, left). The affinity of an antibody to its antigen is measured by the dissociation constant (Kd) – the rate constant of dissociation at equilibrium. The Kd is defined as a ratio of koff / kon, where koff describes the rate of dissociation of the antibody from the antigen, and kon is the rate of association of the antibody to the antigen (Figure 2). As such, the smaller the Kd value the greater the binding affinity.
Affinity is influenced by:
- Hydrogen bonds
- Electrostatic bonds
- Van der Waals forces
- Hydrophobic forces
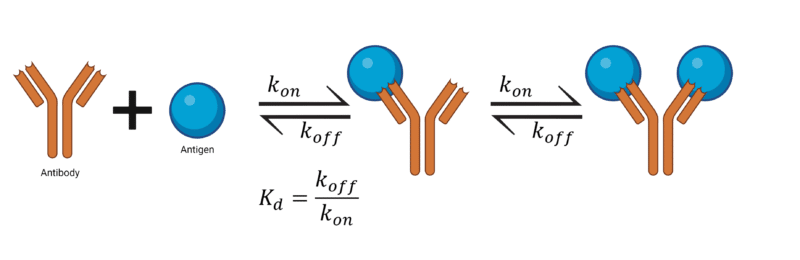
Figure 2. Affinity is measured by the Kd value, which is expressed as a ratio of koff / kon.
What is Avidity?
Avidity, also known as the functional affinity, describes the overall strength of the interactions between all antibody binding sites and a multivalent antigen (Figure 1, right). Avidity can therefore define the strength of polyclonal antibody populations.
Avidity is influenced by:
- Binding affinity
- Valency
- Structural arrangements
For example, IgG, IgE, and IgD have two antigen-binding sites, as opposed to dimerized IgA, which has four binding sites, and IgM with 10 binding sites. It is unlikely that all 10 antigens will disengage from the IgM pentamer simultaneously. Therefore, the avidity of IgM can be relatively high, while the binding affinity of a single binding-site may be low.
Measuring Affinity and Avidity: ELISA or SPR?
Analysis of antibody and antigen complexes has traditionally been done using enzyme-linked immunosorbent assays (ELISAs). However, a major pitfall of this method is that this end-point assay does not provide kinetic, thermodynamic, and/or stoichiometric information. Additionally, ELISAs do not accurately describe the avidity of a complex antibody population. Modified ELISAs utilize chaotropic dissociating agents such as diethylamine, resulting in easily dissociated antibodies from their non-linear epitopes due to conformational changes. This chaotrope-based assay preferentially detects high-avidity antibodies, as they are more likely to remain bound to their antigen after chaotropic dissociation. ELISAs are not as sensitive as other methods, such as surface plasmon resonance (SPR), and are typically unable to detect weaker affinity interactions with fast dissociation rates.
SPR Assay is the Gold Standard for Measuring Affinity and Avidity
SPR is a tool capable of characterizing biomolecular interactions to define real-time binding kinetics of immunocomplexes and other biomolecular interactions. We have previously discussed the underlying theory of SPR and its application for characterizing biomolecular interactions.
Briefly, SPR utilizes a fluid handling system, paired with optical measurements and a sensor chip to measure binding kinetics of biomolecular interactions. The ligand is immobilized onto the sensor chip, which interfaces with the fluid handling system where the analyte and ligand interact. These binding interactions are measured through the optical system, in which a detector measures the shifts in the refractive index (RI) generated by a light source illuminating the metal-coated sensor chip. The shift in RI changes with the molecular binding interactions on the sensor surface and is measured in real-time, actualized in a sensorgram (Figure 3). The RI provides information on specificity, kinetics, affinity, and concentration of the analyte and ligand solution.
SPR is advantageous over other analytical methods and provides a more accurate analysis of affinity and avidity over ELISA methods. Advantages include:
- Real-time analysis
- Label-free detection
- Low sample intake
- Crude sample analysis, including blood and serum
- Provides kinetic, thermodynamic, and stoichiometric information
- No bias for linear vs. conformational epitopes
- Detects weaker affinity interactions with fast dissociating rates
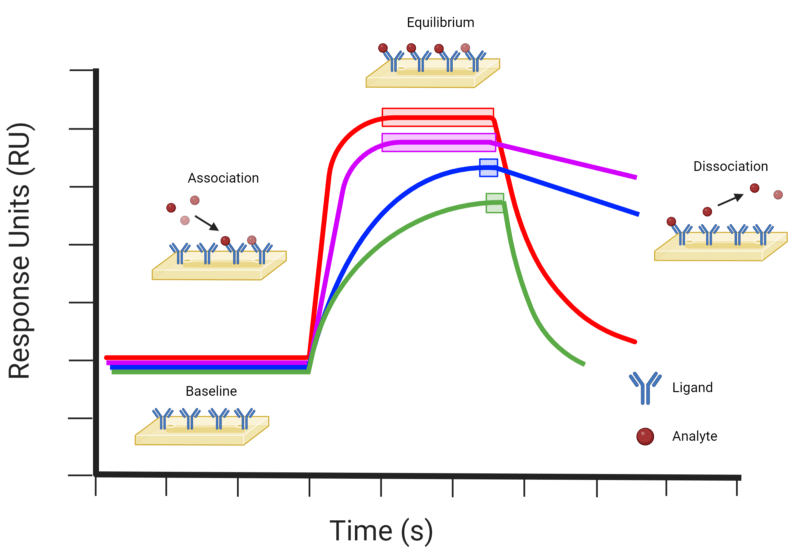
Figure 3. Example of a SPR sensorgram profile, indicating the baseline, association, equilibrium, and dissociation events. The red (−) profile represents a typical molecular binding event with relatively fast association and dissociation rates. The purple (−) profile indicates a molecular binding event with a fast association rate and slow dissociation rate. The blue (−) profile indicates a molecular binding event with relatively slow association and dissociation rates. The green (−) profile indicates a molecular binding event with a slow association and fast dissociation rate. Equilibrium events are indicated on each profile by the corresponding coloured boxes.
Measuring Affinity and Avidity for Biological Applications
Affinity Analysis for Monoclonal Antibody Therapeutic Development
Antibody therapeutics are one of the fastest growing avenues of pharmaceutical development. As such, antibody characterization is an essential step during development to understand the fundamental properties including epitopes, kinetics, specificity, and affinity. As such, affinity analysis of antibodies against their target antigen is a critical step during therapeutic development to screen and identify lead candidates with optimal therapeutic potential.
Avidity Analysis for Monitoring Vaccine Efficacy and Humoral Immune Responses
Monitoring the humoral immune response by measuring antibody avidity can distinguish primary from non-primary infections. Antibody avidity is low during primary infection and increases with time due to affinity maturation. Low avidity serum samples indicate primary infection in response to the pathogen. During recurrent infections, it is likely that the immune response will produce higher-avidity clones due to affinity maturation. Therefore, high-avidity serum samples represent the ‘maturation zone’ and provide evidence for recurrent infection.
Similar strategies can be used to assess candidate vaccines. Successful vaccination regimes provide robust immunity against pathogens by eliciting high-avidity antibody responses. High-avidity antibody responses are correlated to improved antibody neutralizing activity. As such, SPR-based avidity analysis on polyclonal serum can monitor the induced antibody response and quantitate the avidity of antibody populations in response to immunization regimes, vaccine candidates, and adjuvant development.
Affinity and Avidity Analysis via SPR Assay with Rapid Novor
Here at Rapid Novor, we employ a nanotechnology-based localized SPR platform to provide a comprehensive kinetic profiling of your antibody-antigen interactions. Through our SPR kinetic binding analysis service, we can help determine antibody binding affinities and avidities, association rates, and dissociation rates to support lead identification efforts and research and development pipelines. To learn more about our services, inquire with our scientists.

Talk to Our Scientists.
We Have Sequenced 10,000+ Antibodies and We Are Eager to Help You.
Through next generation protein sequencing, Rapid Novor enables reliable discovery and development of novel reagents, diagnostics, and therapeutics. Thanks to our Next Generation Protein Sequencing and antibody discovery services, researchers have furthered thousands of projects, patented antibody therapeutics, and developed the first recombinant polyclonal antibody diagnostics.
Talk to Our Scientists.
We Have Sequenced 9000+ Antibodies and We Are Eager to Help You.
Through next generation protein sequencing, Rapid Novor enables timely and reliable discovery and development of novel reagents, diagnostics, and therapeutics. Thanks to our Next Generation Protein Sequencing and antibody discovery services, researchers have furthered thousands of projects, patented antibody therapeutics, and ran the first recombinant polyclonal antibody diagnostics